In this post I indicated that I thought silver needed to take a breather according to my EW model. Below is the original chart model I provided in that post. It predicted a pull back to the lower channel somewhere in the price range of $21.25 to $21.75:
I followed that up with
this post indicating that silver had a bit further to fall but that it would be a buying opportunity, not a sell signal. Today we hit the lower channel as you can see from the chart below. It took a bit longer to get there than anticipated and thus we did not quite hit my price target but with EW the shape of the wave is more important than absolute prices. As a result of hitting this lower channel,
I suspect the pullback in silver could be over for now.

For the record, this pullback does not really look like a simple a-b-c to me. I only documented it like that on the chart above for simplicity. In fact it looks more like a descending triangle with 4 clear rail bumps (the 2 in the middle are not annotated in this drawing) followed by a failed 5th bump. That 5th bump may still play out but now it is a battle between those trading computers whose software thinks parallel channels are more important and those who think full rail bumps are more important. If we do get a 5th rail bump then it would cause the chart to hit my original price target range but I would not count on it.
I give it 30% chance of breaking below the lower support channel and 70% chance of now moving back up to build the 5th wave of this series which should hopefully hit the next resistance point at about $25.
A break down of the current support point would not necessarily be bad news for silver unless it happens with gusto and with volume. If that happens, another look at the chart will be warranted to see what new direction the herd might be taking.
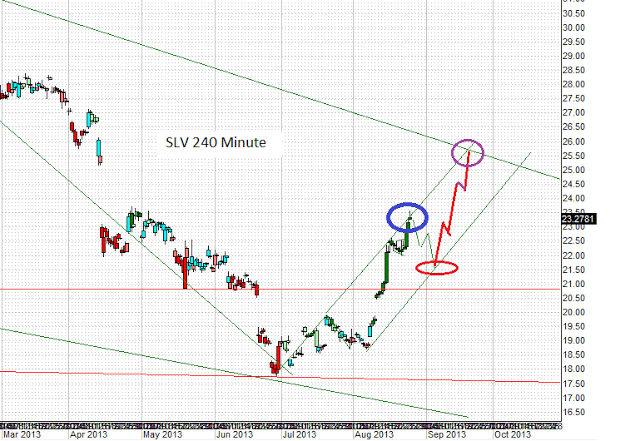
The reversal in silver from longer term down trend to new uptrend is really not confirmed until the down trending upper resistance line of the of the past 2 year silver bear market is broken out of. I think it will take the power of a 3rd wave to do this. So I see it playing out as shown below. In words, 5 waves up that test the resistance from below at around the point of the blue circle to form a wave 1 up. This is followed by a pullback into wave 2 which then reverses into a dramatic 3rd wave up which breaks through the resistance at about the location of the green circle and signals a new bull market for silver. Note how the nearly horizontal purple resistance line intersects with the down sloping bear market resistance line. Where trend lines converge there is a much higher chance of something important happening than if only a single trend line is involved.

For silver to have a big move at that point I think we will need to see other issues driving it but I do not know what those geo-political-economic issues might be. In other words, silver could but will most likely not move like this in a vacuum. There more likely needs to be some catalyst that justifies a 3rd wave buying spree of silver. Maybe it's war. Maybe inflation, maybe something else. Time will tell. Failure to punch through the top resistance line as shown at the green oblong above will make me rethink this model. If a 3rd wave can't do it then I will question if it is really a 3rd wave... But so far it just looks like a massive pennant formation is now breaking out and so I see this very recent weakness as a buying opportunity.
 For the record, this pullback does not really look like a simple a-b-c to me. I only documented it like that on the chart above for simplicity. In fact it looks more like a descending triangle with 4 clear rail bumps (the 2 in the middle are not annotated in this drawing) followed by a failed 5th bump. That 5th bump may still play out but now it is a battle between those trading computers whose software thinks parallel channels are more important and those who think full rail bumps are more important. If we do get a 5th rail bump then it would cause the chart to hit my original price target range but I would not count on it. I give it 30% chance of breaking below the lower support channel and 70% chance of now moving back up to build the 5th wave of this series which should hopefully hit the next resistance point at about $25.


No comments:
Post a Comment