
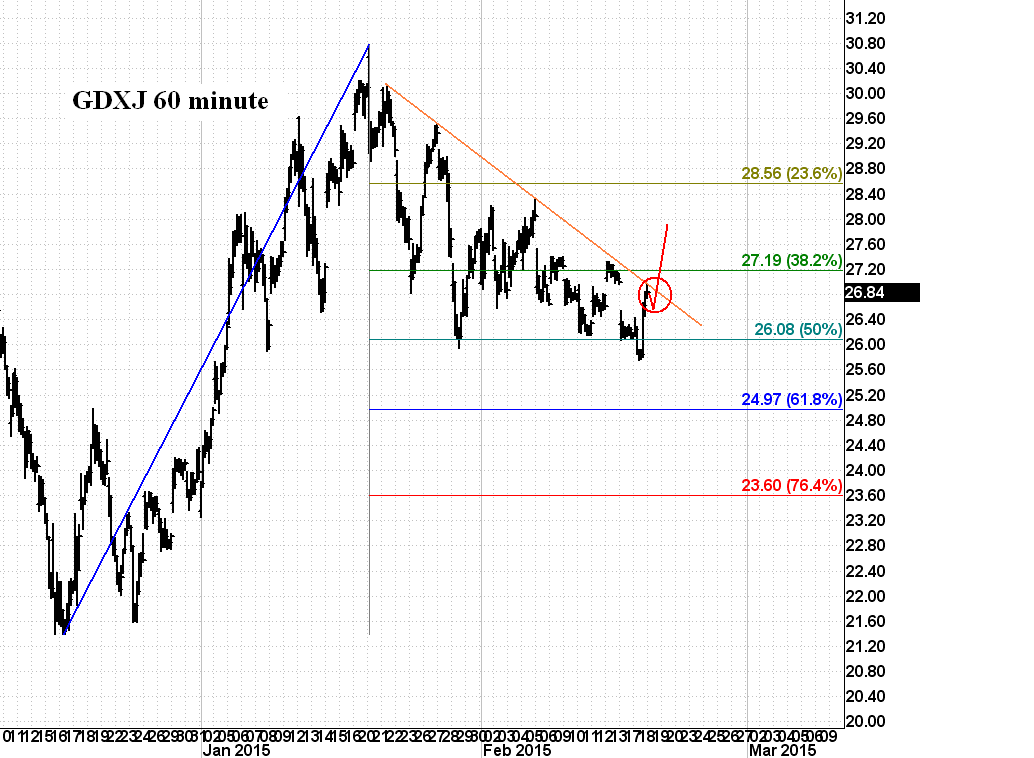
Today GDXJ kissed the upper rail and so I'm modeling that tomorrow it takes a step back into wave 2 and then powers through as shown. IFF this occurs it will be the official signal that the miners have begun their next big wave up. If there is an opportunity to go long, I prefer it over going short. This is a monster opportunity for being long something, this should be a 3rd wave (or a C wave). I plan to play it with JNUG but the GDXJ chart is a great proxy given the fact that TDAmeritrade will not respond to my emails requesting them to fix the JNUG chart post split.
By the way, there is no law that says this rail test must result in a break out and if it doesn't we will see a quick trip to the 61.8% fib. That is not my primary count but stops at 26.40 are still recommended. First rule: don't lose (much) money on any trade.
In the bigger picture, EWI and many others think that the recent low in gold was the bottom of an "A" wave which began in late 2011. At that time, GDXJ was an astounding $179.50. The juniors were raking in the cash hand over fist with gold near $2000.
- Note to self: when juniors are too profitable, gold is probably overpriced....
Think about that concept for a second: "mining money" If you manufacture a product like computers, toasters, cars, clothing, etc. you have to put time and energy and technology into it. You cannot just do the same thing again next year that you did last year - nobody will buy it. You risk getting stuck with a ton of inventory. You cannot just "manufacture it and they will come". Microsoft lost 1.7 billion USD on Surface Pro 1 and 2 which were both perfectly good products. It was only the Surface Pro 3 that finally caught consumer attention. Microsoft built it and nobody came!
Gold is different and in this way unique: you don't need sales, marketing, high tech engineering, or any of that stuff. You just repeat what you did last year and someone will always buy your product at the prevailing rate. You might not be able to control the price but there is ALWAYS an extremely liquid market for your product and that is a big, big advantage.
If we are in the very early stages of a massive a-b-c corrective move that retraces the entire sell off then the least bounce I would expect would be to the 38.2 fib for the miners. That is for the big miners as represented by HUI and GDX. The juniors should also at the very least get the 38.2 but I have to believe that the 50 fib is more reasonable given their volatility. If they only make it to the 38.2 before turning around and falling into the big C wave that EWI and others expect, GDXJ will go negative long before length of C = length of A. It is just unreasonable to expect that; the buyers will step in. So the bounce must take that into account.
So let's be real conservative here and expect GDXJ goes to the 38.2 fib and not the 50. Well as you can see from the chart below, the just lowly 23.6 fib is at $58. That is well over 2x current price. So at this point it doesn't matter who ends up being right (Avi or EWI even though so far EWI is in the lead) because both of their models predict a big rise for gold for the remainder of the year.

I also want to point out that if GDXJ takes off from here and then crosses above the green line then we have ourselves a very likely inverted head and shoulders. Of course I would call it 1-2-3 but the legacy TA guys would see it as a H+S. Both of us would have similar price targets but the legacy TA crowd (and their trading computers) will take the length of the head and add it to the green neckline as shown above. Thus, the price target for the 3rd wave could be as high as $40. I do not think that will be the end of it! I think that will be 3 of A with 5 of C eventually going up much higher. If you very very conservatively assume the 38.2 fib then we are talking... wait for it... $81.21.
By the way, H+S is generally a significant topping pattern while inverted H+S a significant bottoming pattern. If this turns out to be an inverted H+S then it is most likely a significant bottom (which the bottom of A of the gold bear would indeed be). It's as true for stocks as for women: significant bounces come from significant bottoms.
I also want to take this opportunity to plant one more seed regarding price target. Those of you who have been reading this blog since late last year have been seeing me write about the big 4th wave that played out just before the massive collapse (percentage wise for sure) of GDXJ and JNUG into the 5th wave low. We all know that the level of the prior 4th is the initial EW target for the bounce, so some could be thinking it ends in the $40 to $50 range but I am telling you right here and now that this is not going to be the case.
That big 4th wave that sucked up a full 18 months of calendar time was likely not the 4th of A. No my friends, it was most likely an outsized 4th of 5 of A as shown below. There is no way GDXJ is only going to bounce to only $40 after losing 90%!! The very least will be the 38.2 at ~$82. But even that is questionable because if red 4 was only the 4th of blue 5 then blue 4 is the real "prior 4th" that we should be targeting under EW guidelines. That prior 4th (blue 4 below) happens to live at almost exactly the 50 fib which is where I just explained that GDXJ should gravitate to if GDX/HUI will do the 38.2.
In addition, the price level tied to blue 4 happens to be a strong psych support/resistance. Look at Aug 2011 while everything was on the way up. You can see that after breaking $100, it back tested it from above, found support and then skyrocketed 80% more from there. Well if the coming rally is a retracement then I think that is where major, major, major resistance will lie. So there are multiple factors which align to make me believe that GDXJ will hit the high 90s or even kiss $100 by the end of 2016. $100 is now my official price target for this big GDXJ bounce.

If you think that is good, then you will really like the associated JNUG price target of >= $180.
Oh I can hear many of you right now: "The Captain is smoking crack. JNUG is only trading at $30. $180+ my freaking eye.". If this is what is going through your head then please review some history of my prior calls. For example, check this post from July 17th 2014. At the time GLD was putting in C of 4. JDST was falling like a brick. Here is what I wrote:
"So let me tell you something and it will just be our little secret: if
that line breaks the top channel and then comes back down into the
channel then JDST is a BUY BUY BUY. That break down back into the
channel gives you two things:
- first confirmation that the 4th wave is over and that you are now working on a 5 wave move down into the 5th wave.
- a clear and unambiguous sell trigger. If it breaks down into the channel then set stops just above the channel and let it go.
As it turned out, GLD did a short stroke E of 4 so JDST never made it all the way down to $6. but the magnitude of the a-b-c recovery rally was right in line with my "5 bagger" target (it would have had to go to $45 to be the full 5 bagger). CLEARLY you must stay on top of this because the daily moves are scary fast in this kind of retracement but the 2015 M+M rally that is coming should be many months long so you should not be afraid to just buy and hold with stops below your buy price (and moving them up as the EW count allows.
 One final word to the wise: the move will likely be back end loaded. The first wave up is A. C wave should be stronger at least in terms of movement per unit time. If this $200 downward move on GLD back in July 2014 produced a 4-5 bagger on JDST then do not underestimate the potential for JNUG to go 8x-10x+ (8-10 bagger) from the recent JNUG low of $18.30 for the coming move to $GLD $140 (38.2) fib. That is$250 from current levels in the physical metal. The 50 fib of GLD is also possible at $147.


No comments:
Post a Comment